The invisible water sponge above us
Standard weather alerts focus almost exclusively on air temperature. But temperature alone cannot tell you how aggressively the atmosphere pulls moisture from the soil, foliage, and open water.
Discover when atmospheric demand for water rises unusually high — and understand what it could mean for farms, lakes, and reservoirs. Seven-day thirstwave forecasts for three Karnataka pilot districts.
"Everyone forecasts how hot the air will be.
Nobody forecasts how thirsty it will be."
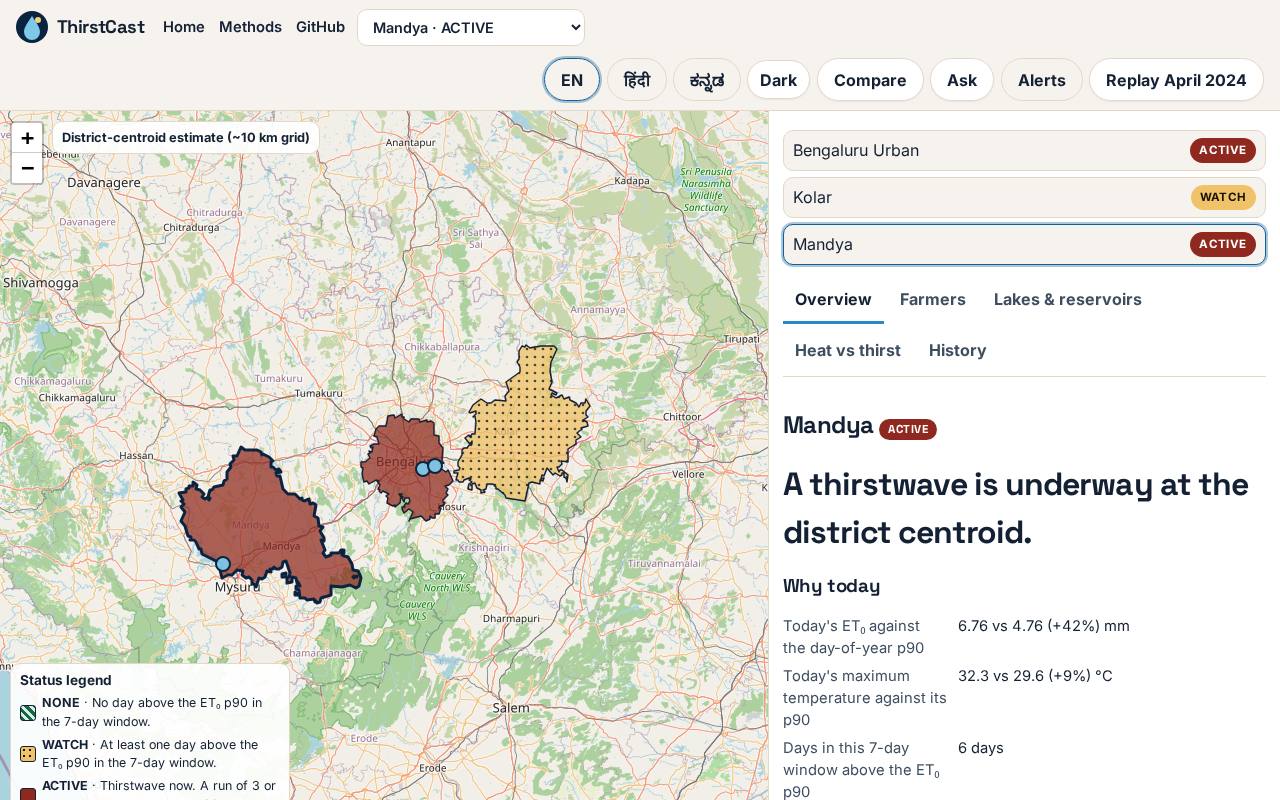
ThirstCast uses ET₀ — reference evapotranspiration — and 30 years of local historical thresholds to detect multi-day thirstwaves and translate them into estimated extra water demand, in litres.
ET₀ represents atmospheric evaporative demand: how strongly weather conditions drive water loss from a reference surface. When ET₀ stays above its local seasonal 90th percentile for three or more days, a thirstwave has begun.
Standard weather forecasts track air temperature. ThirstCast reveals the invisible atmospheric pull on water — step by step.
Standard weather alerts focus almost exclusively on air temperature. But temperature alone cannot tell you how aggressively the atmosphere pulls moisture from the soil, foliage, and open water.
Solar radiation, wind speed, vapor-pressure deficit (dryness), and heat combine into a physical pulling force called reference evapotranspiration (ET₀). When the air is hot and dry with high wind, this pull intensifies dramatically.
A 6 mm/day rate in April might be routine for arid Rajasthan, but extreme for coastal or south interior Karnataka. ThirstCast compares every day's ET₀ against that specific location's 1994–2023 day-of-year 90th percentile threshold (p90).
A thirstwave is declared when ET₀ exceeds the local seasonal 90th percentile for three or more consecutive days. It isolates periods of sustained, compound atmospheric thirst from brief, normal hot afternoons.
Excess millimetres of atmospheric pull translate directly into water volume. Using FAO-56 crop coefficients (Kc) and lake surface areas, ThirstCast computes estimated additional litres required per acre of crop and millions of litres lost from reservoirs.
Monitor live 7-day thirstwave alerts, query our AI advisor in English or Hindi, and explore historical evidence for Karnataka's pilot districts.
April 2024 was the highest-demand April for Bengaluru Urban since 1994 (ERA5, rank 1 of 31). The charts below use ERA5 reanalysis — not real-time data.
Cumulative excess ET₀ for each April. The highlighted bar is 2024.
April only. Other months are not computed.
ET₀ above its p90 while Tmax stayed below its own p90 — the hidden demand nobody measured.
Each district represents a different water-stress context: urban lakes, dryland agriculture, and reservoir-irrigated crops.
These open the dashboard with the AI chat pre-filled. Nothing is sent until you press Ask.
Together they set how fast water can leave a crop or a lake.
That pull is reference evapotranspiration, ET₀, in millimetres per day.
A thirstwave is 3 or more consecutive days above the local day-of-year 90th percentile.
Excess ET₀ is converted to extra irrigation need and surface-water evaporation loss.
Heat alerts say the air is hot. ThirstCast says how much faster water is leaving the surface — in litres — for a farmer, a lake manager, and a city planner.
Weighted for cropland area harvested, thirstwave intensity, duration, and frequency have increased by 0.06 mm d⁻¹ decade⁻¹, 0.10 days decade⁻¹, and 0.39 events decade⁻¹, respectively during 1981–2021. Statistically significant trends appear across 17%, 7%, and 23% of cropland area for intensity, frequency, and duration.
This said, according to experts, there is essentially no data about extreme thirstwaves over India.
The same JSON the map reads. Replace $API with the deployed ApiUrl, without a trailing slash.
curl "$API/districts"
curl "$API/thirstwave/Mandya"
curl "$API/replay/Bengaluru_Urban"
curl -X POST "$API/ask" -H 'content-type: application/json' \
-d '{"question":"Will Mandya face a thirstwave this week?"}'
Lead
Profile link coming soon
Data
Profile link coming soon
Frontend
Profile link coming soon
Agent and demo
Profile link coming soon
Seven-day thirstwave forecasts. Litres per acre. Real historical data. Open API.